

Your sprint metrics lie (but these 4 don’t)
Forget story points and velocity. Measure only what proves added value: deployment frequency, production bugs, cycle, and lead time.

This is “Effective Delivery” — a bi-weekly newsletter from The Software House about improving software delivery through smarter IT team organization.
It was created by our senior technologists who’ve seen how strategic team management raises delivery performance by 20-40%.
TL;DR
IT teams manipulate story points to look better without improving
Some metrics encourage cheating rather than delivering value
IT managers can encourage productivity by showing metrics as proof of success rather than failure
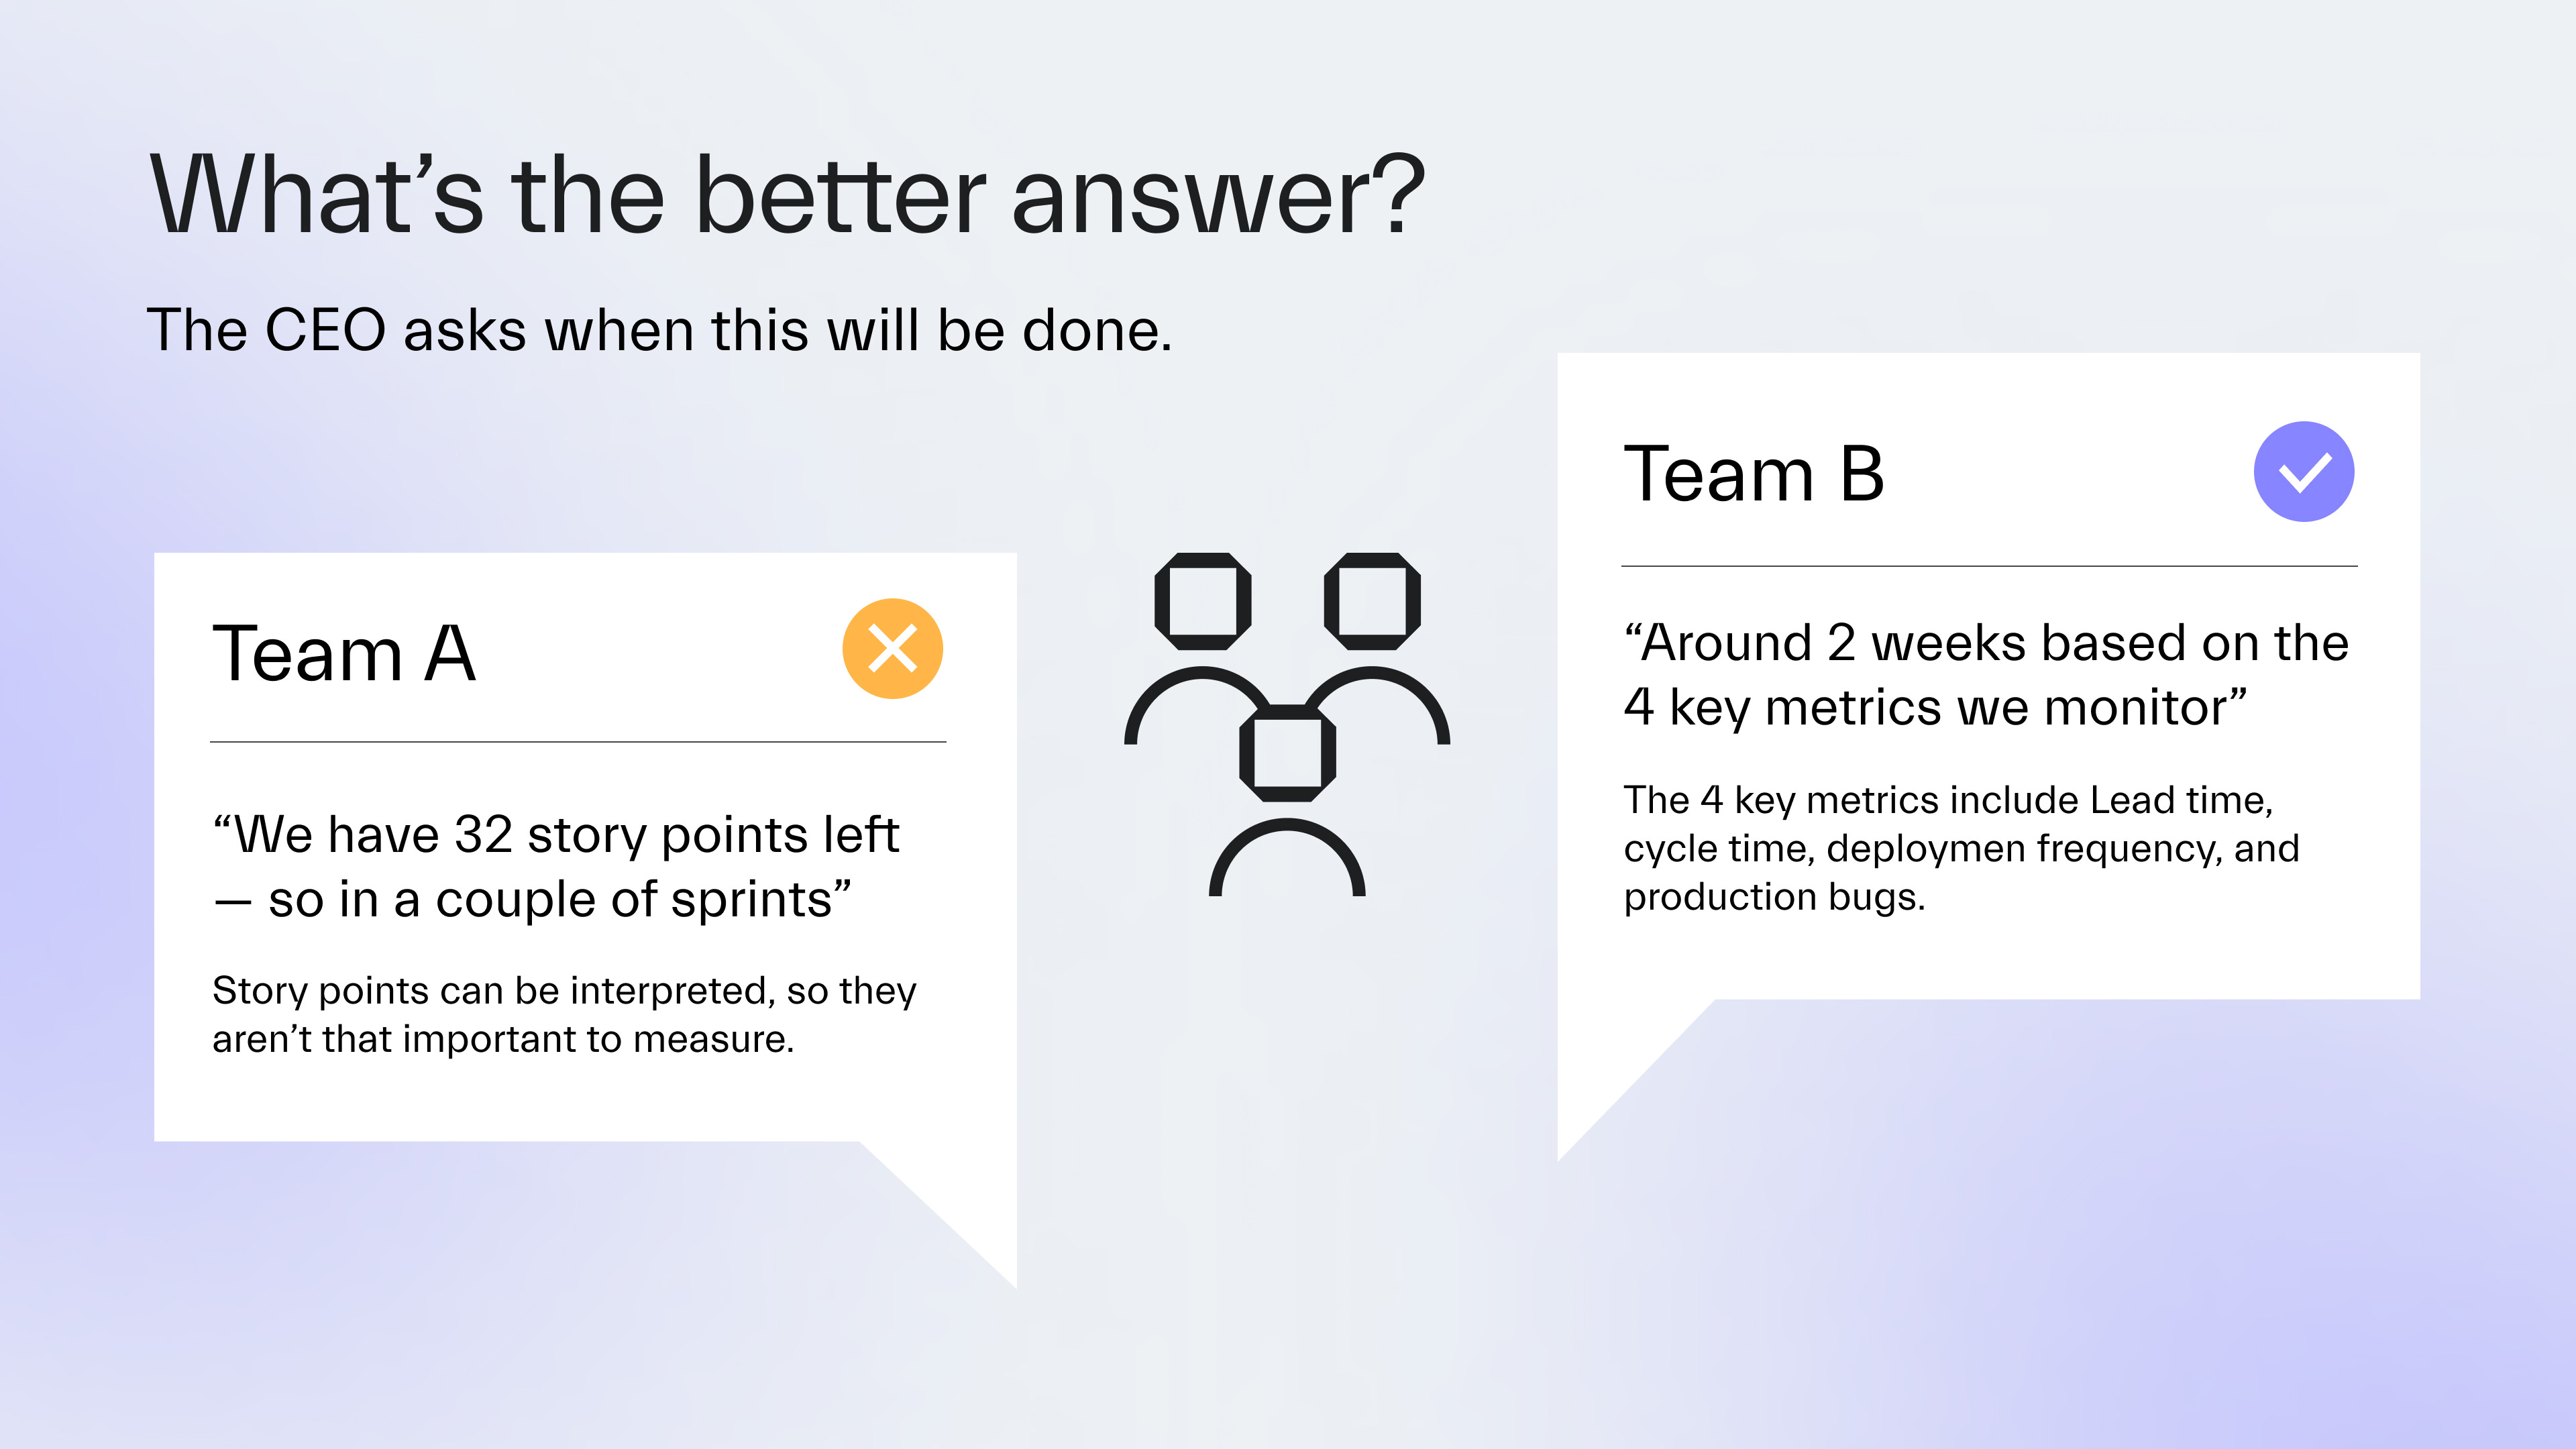
The solution is to track four metrics proving efficiency: deployment frequency, production bugs, cycle time, and lead time.
Contents
Hello! It’s Adam again.
I’ve helped deliver over 160 IT projects.
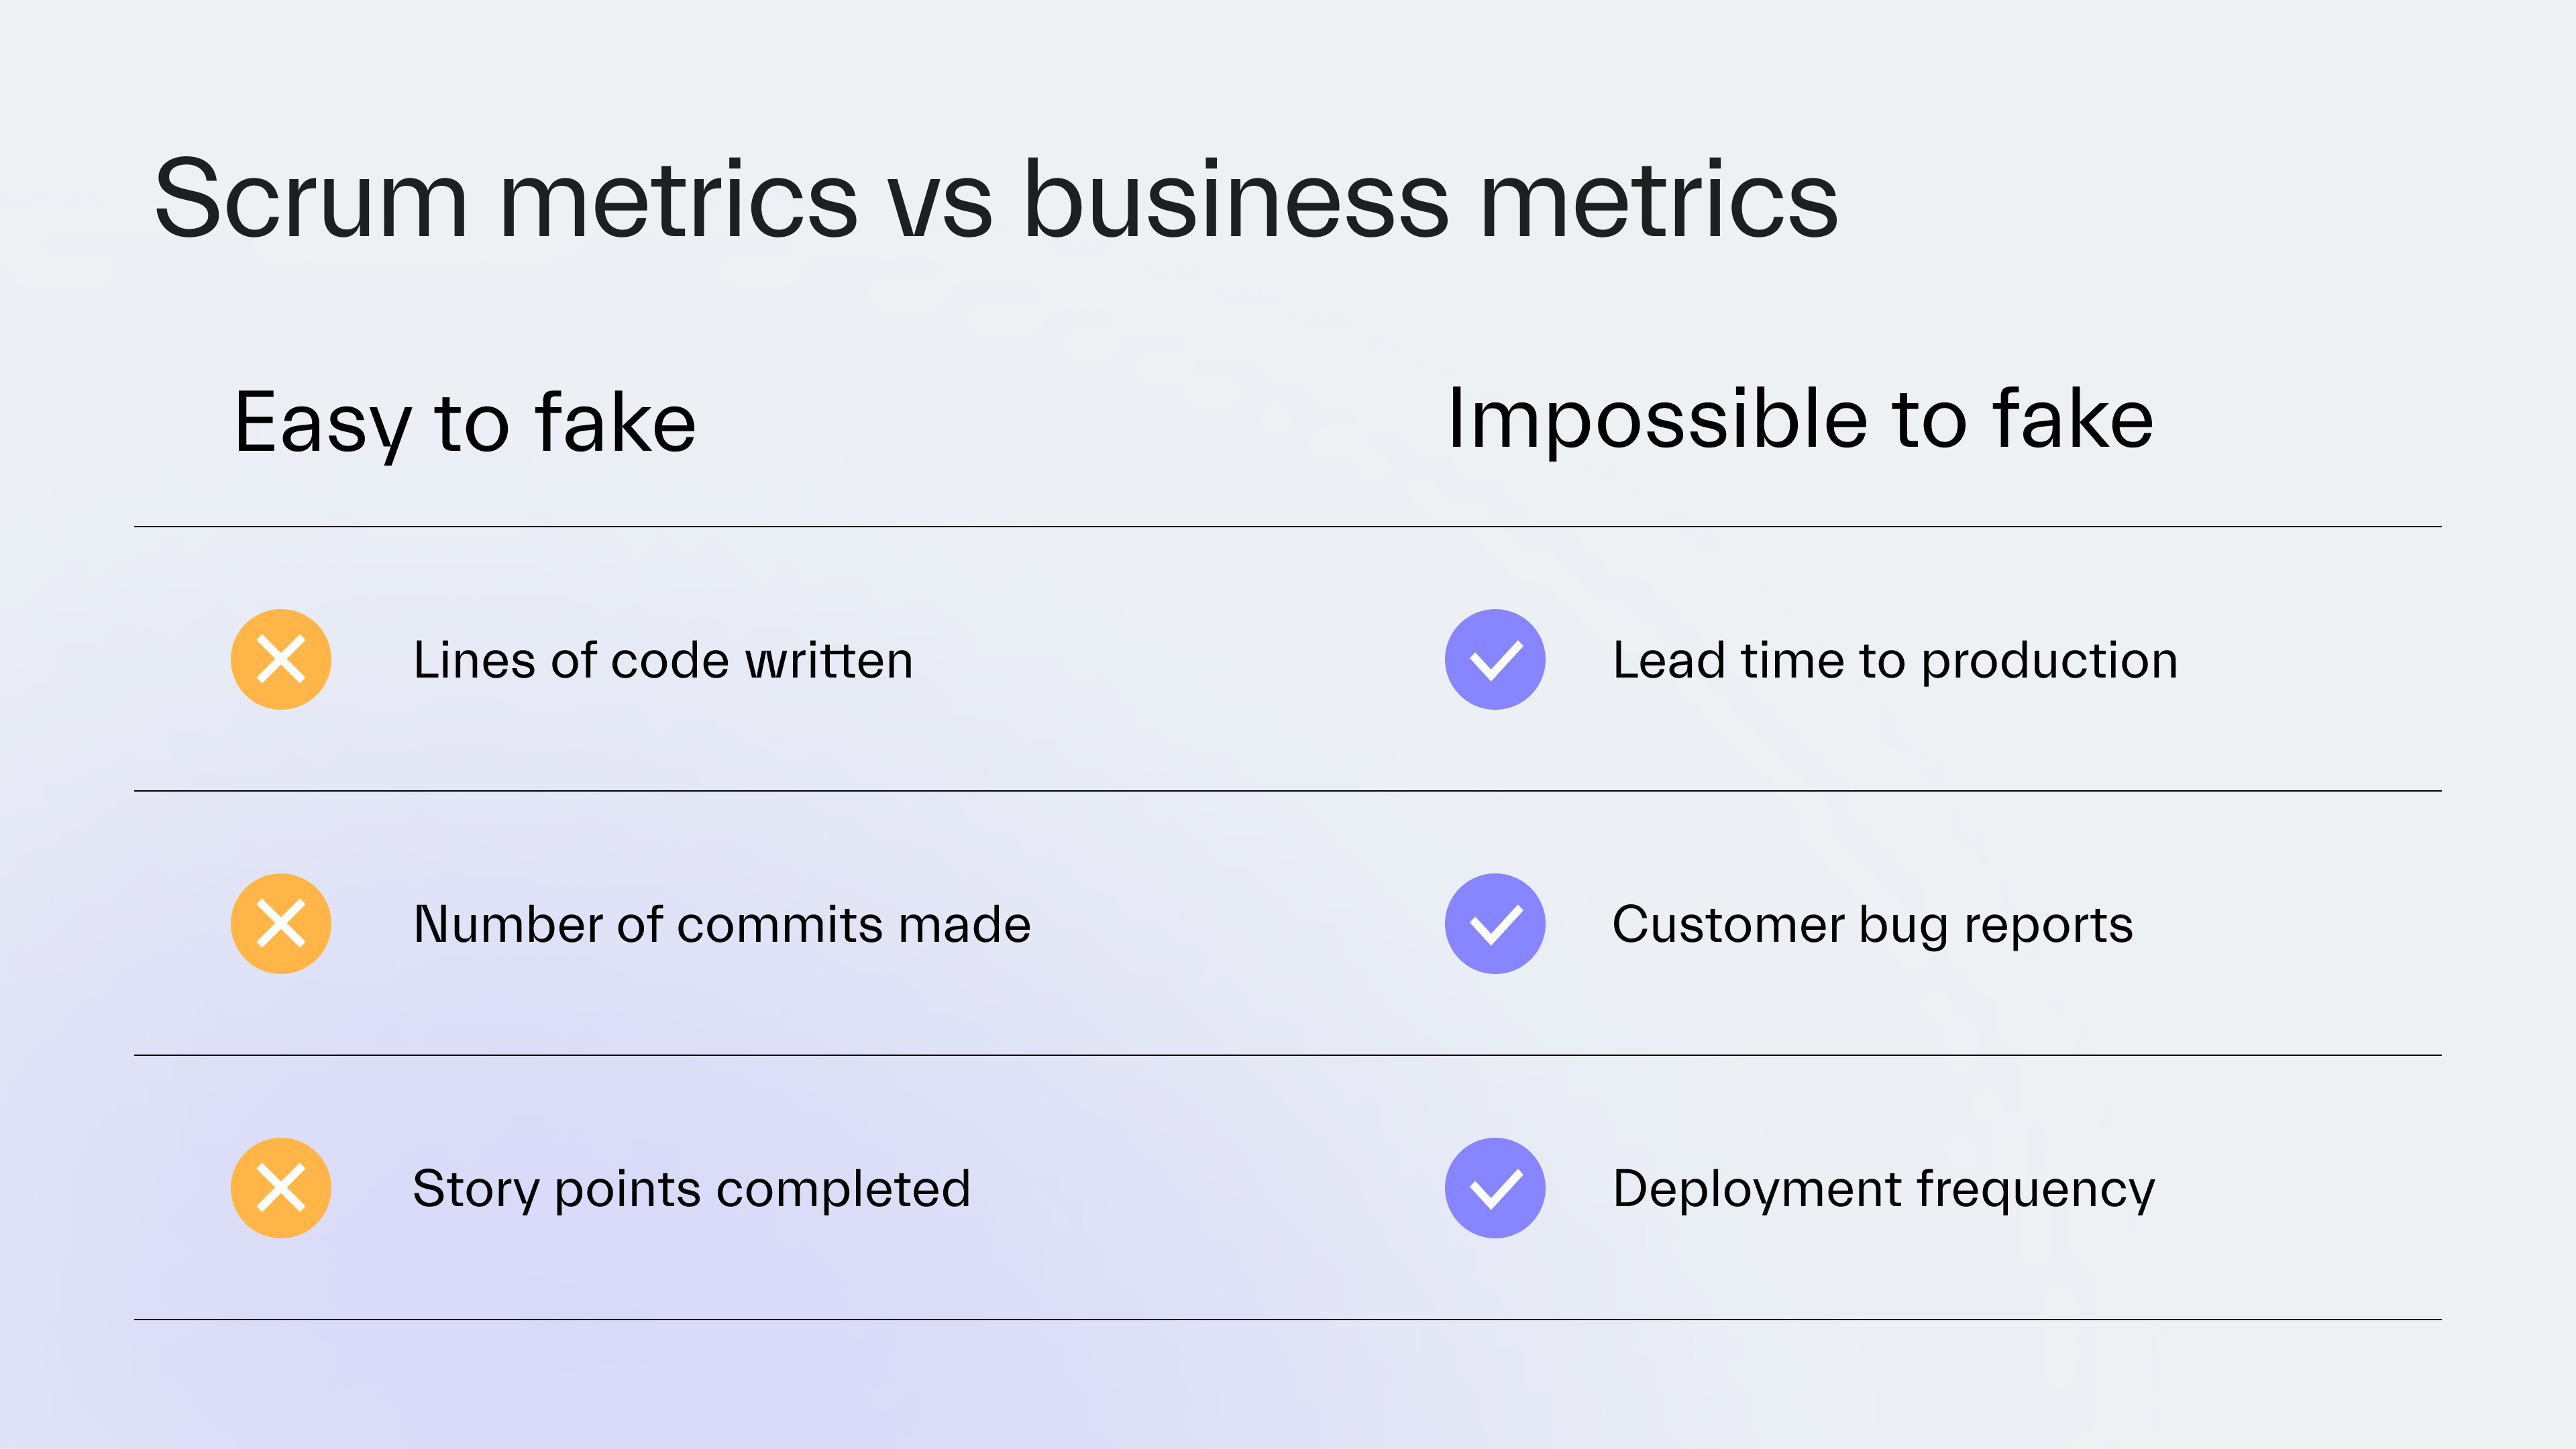
And I continue to notice is that many IT managers track delivery using vanity metrics like:
Story points
Velocity
Number of code lines written
Number of commits
Number of pull requests
They’re useful. But, most of the time, they only create the illusion of success.
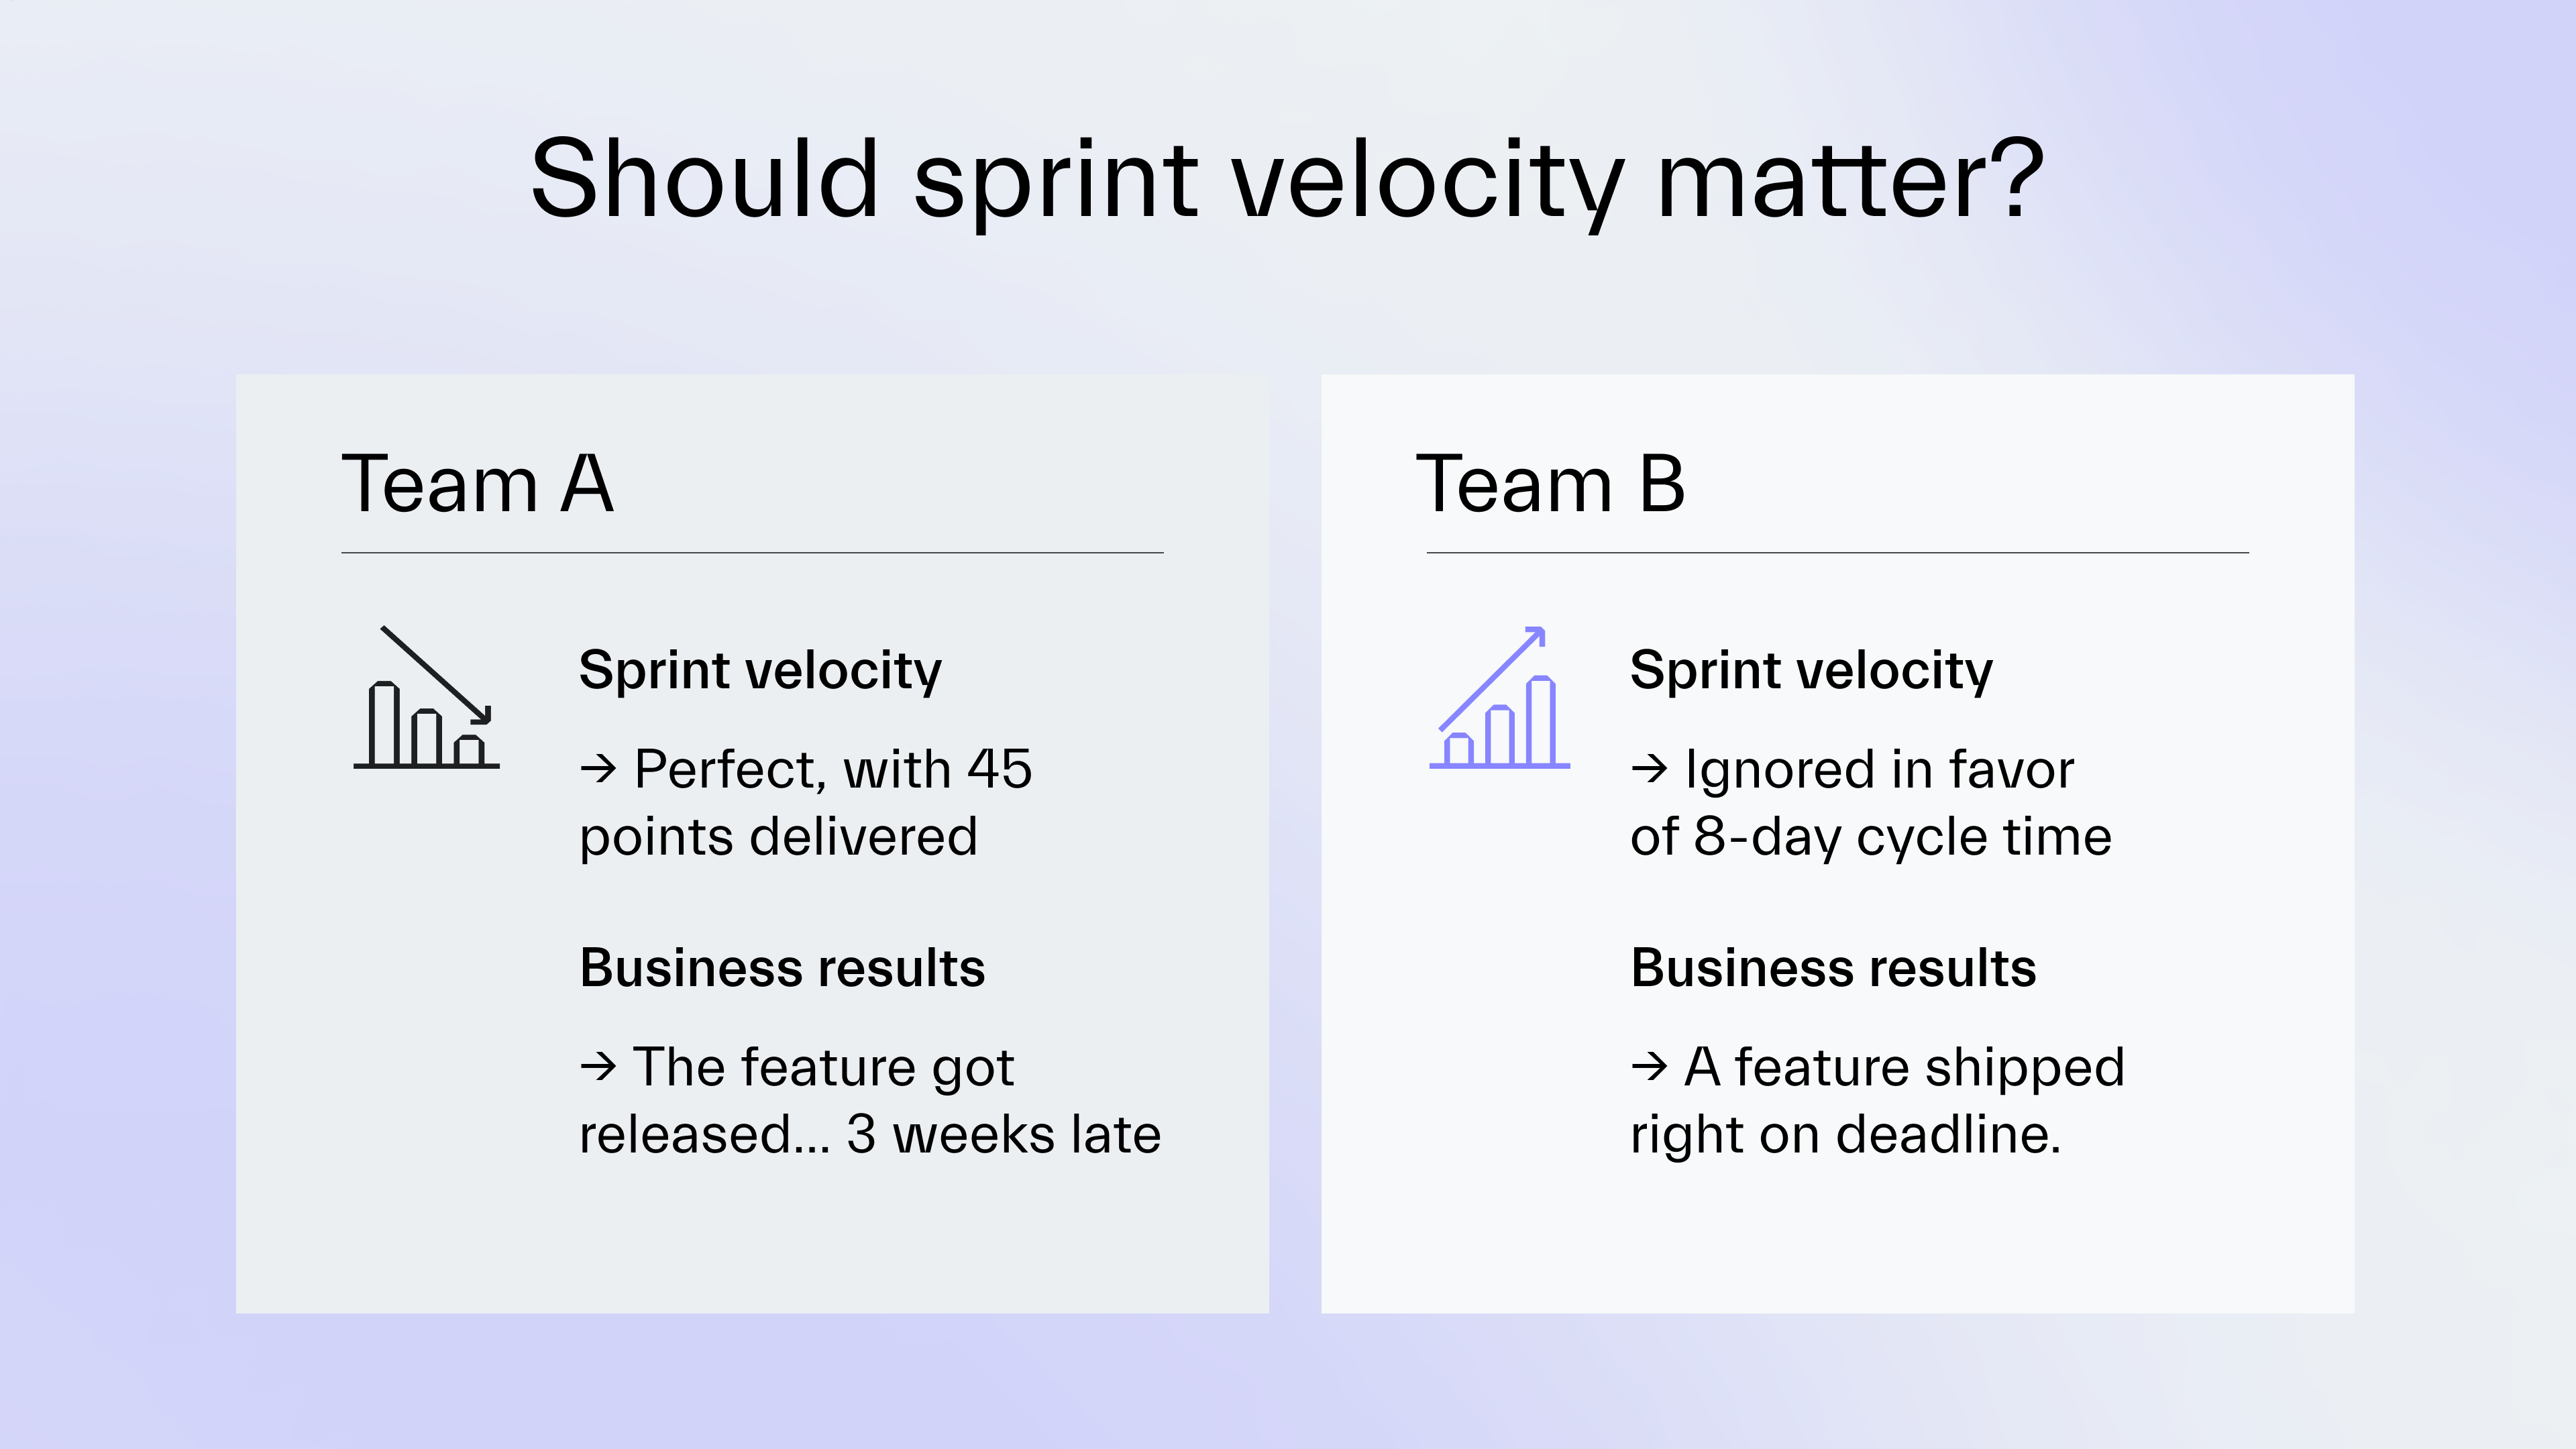
I saw projects where teams delivered their sprints perfectly for months with stable velocity.
And yet, product updates kept being delayed..
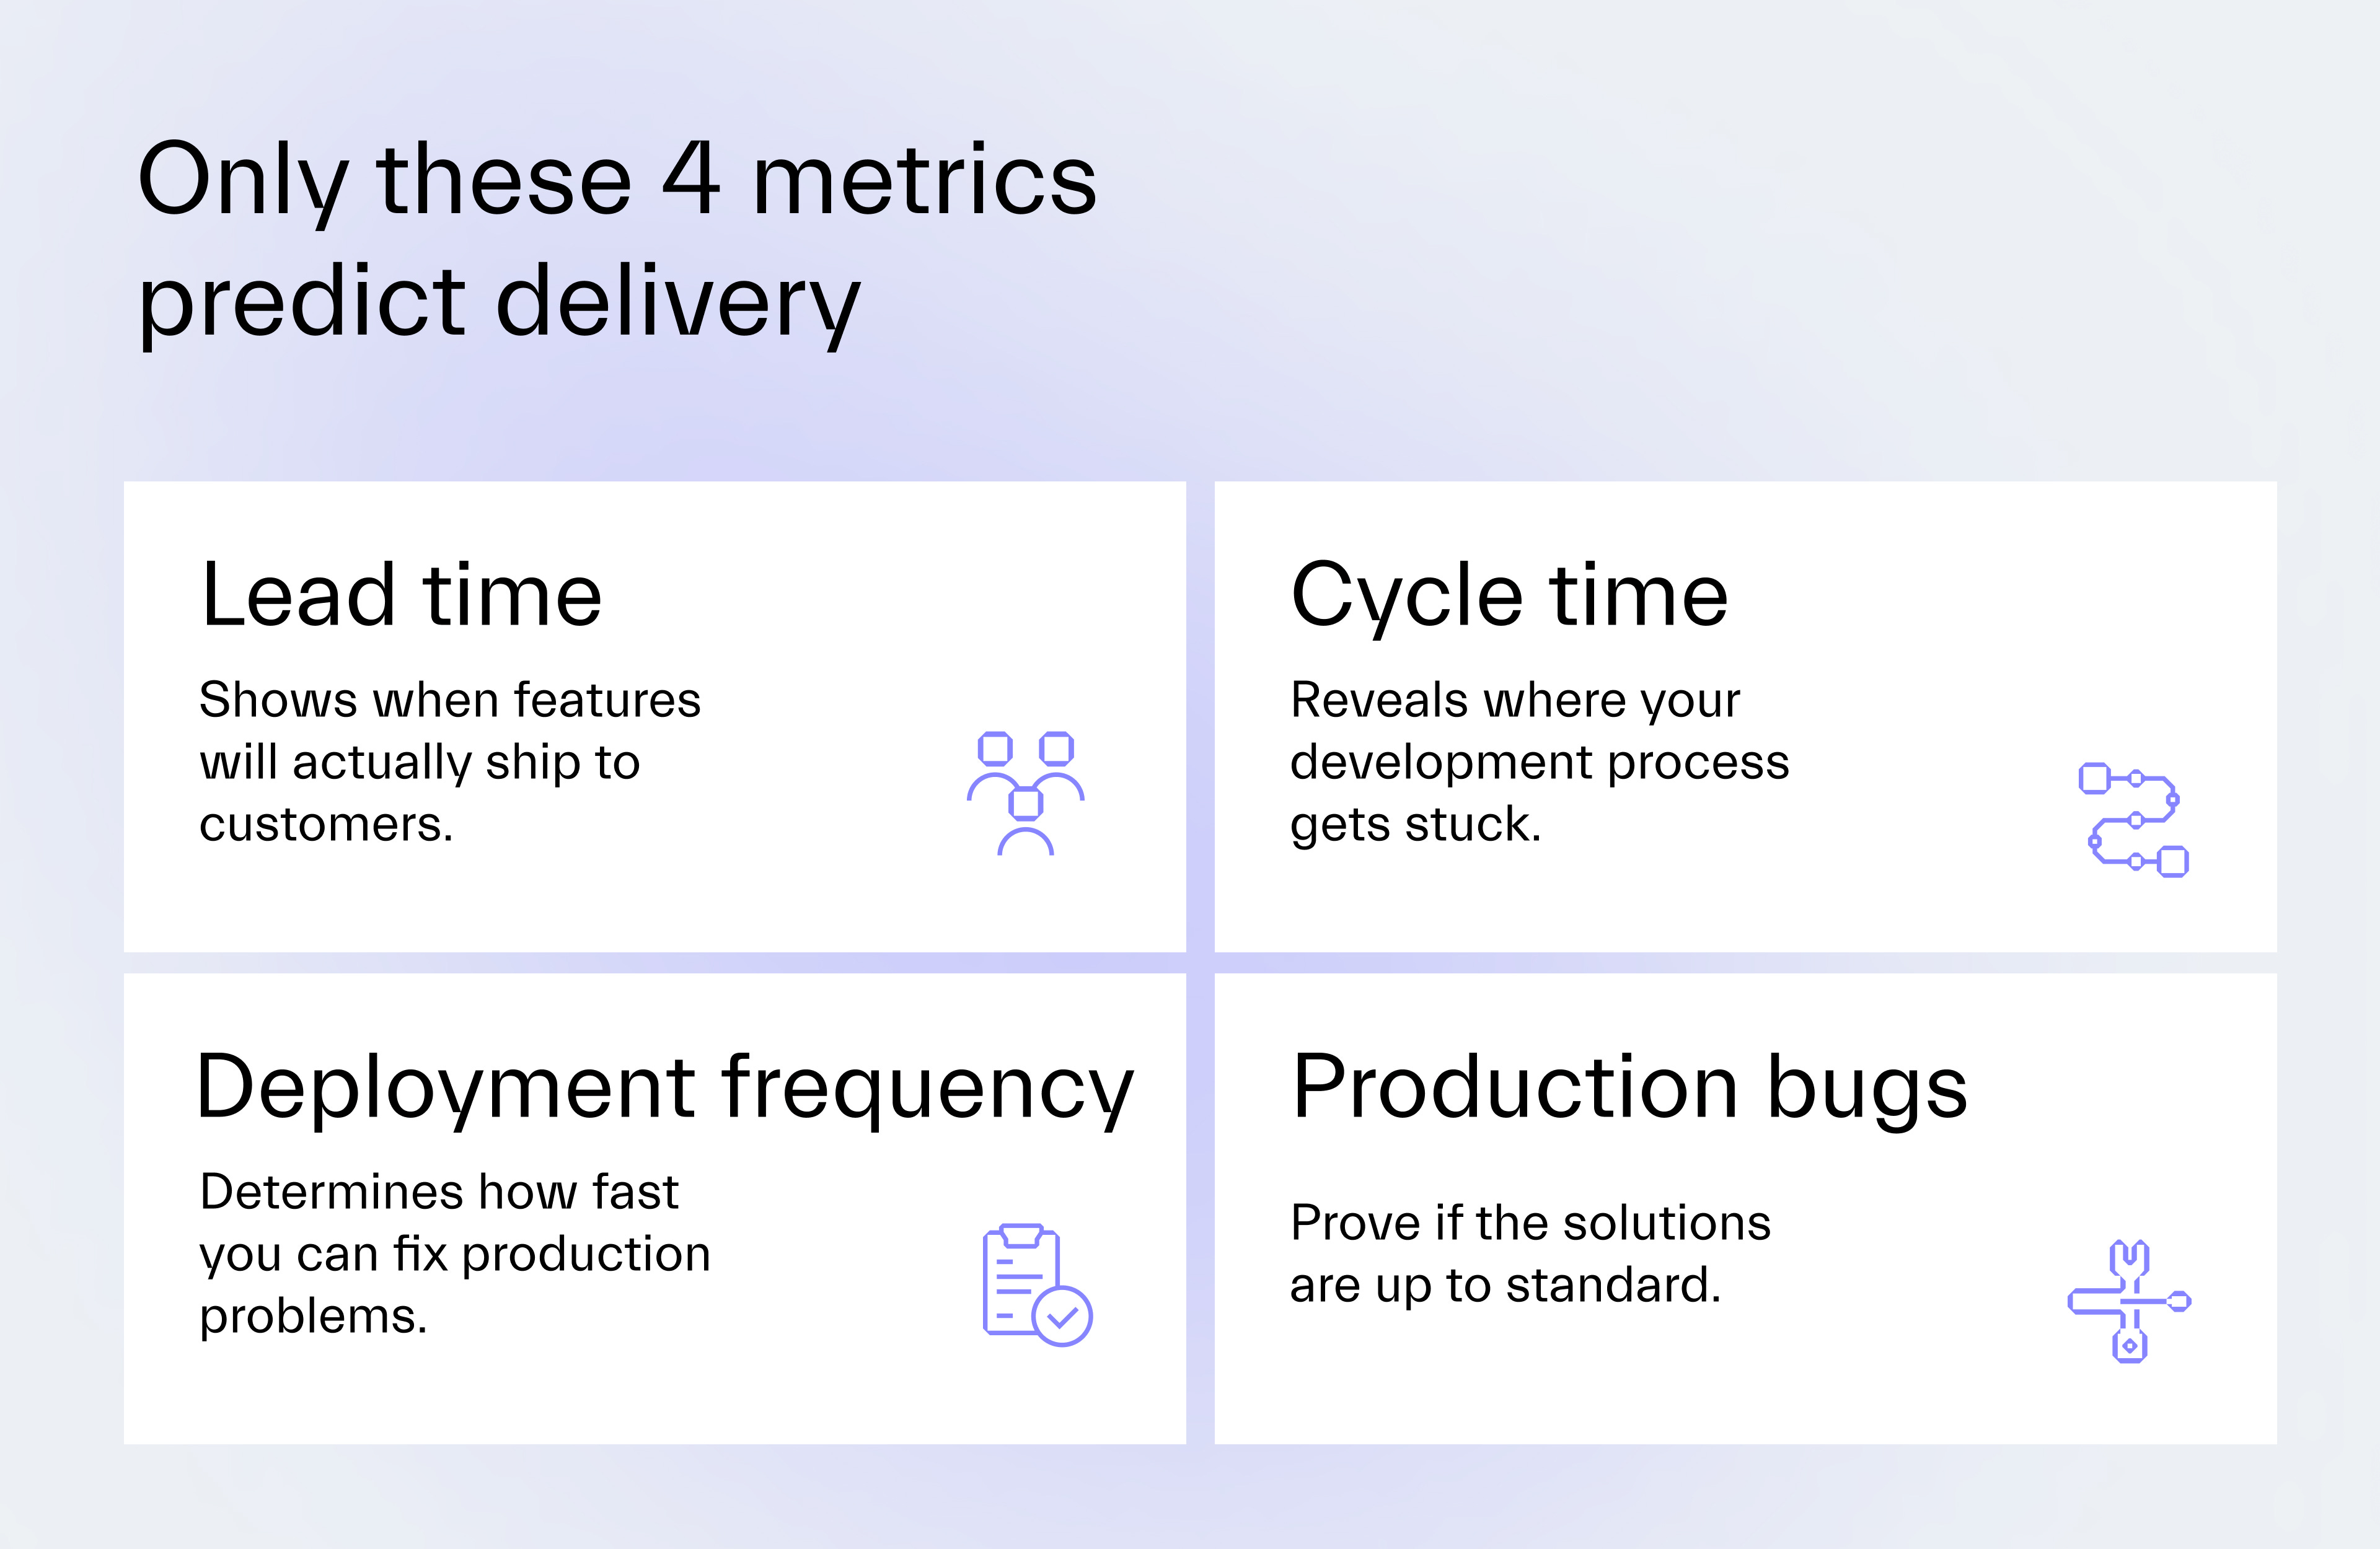
As a CTO, I believe that only four metrics actually show if teams deliver business value:
Deployment frequency
Production bug count
Cycle time
Lead time
Why managers choose the wrong metrics
They’re simply stuck in a cycle of observing and fixing irrelevant metrics.
And the only thing that should matter is the business value that IT helped to produce.
1. Scrum encourages faking progress
Teams control what goes into sprints and how many story points each task costs, which means they can manipulate these numbers.
That’s also why every team estimates differently.
One team can say a CRUD operation takes 3 points while another says 8 points.
Quite often, when a team fails to deliver a sprint, it will first reduce the scope for the next one.
But its efficiency won’t improve.
2. Doing what everyone else does
I believe that most managers honestly try their best to measure efficiency.
It’s just that the metrics they choose don’t prove the team delivers business value.
Many managers believe that velocity will tell them what they need.
However, velocity depends on each team’s circumstances, making it difficult to compare the velocity of two different teams.
As a result, managers don’t have a benchmark against which to weigh their team’s performance.
The same goes for metrics that focus on individuals.
We had a client who connected a tool to GitHub that measured commits, lines of code, and pull request frequency.
Developers responded by making many small commits instead of writing pragmatic code.
The project quality dropped because everyone optimized for the metrics instead of creating value.
If you tell a team you want more pull requests, they’ll split one meaningful change into ten.
The metric improves, but the actual work doesn’t get better.
3. Metricphobia
Engineers tend to see metrics as weapons to be used against them rather than helpful tools.
They rarely hear which metrics their CTO is reviewing, or what impact such measured results can have on their future at the company.
Fear forces them to optimize for the vanity metrics I’ve mentioned.
The 4 metrics that prove business value
After years of working with clients across 8 industries, I’ve concluded that there are only 4 metrics that matter for measuring delivery efficiency.
These metrics meet 2 critical conditions:
They prove if the feature team can deploy quality code quickly,
The numbers can’t be easily gamed or manipulated.
Let’s review them.
1. Deployment frequency
This metric reveals the team’s capability to respond to problems.
If the team can’t deploy daily, a critical production bug might take too long to fix.
You can’t fake this metric as deployments either happen or they don’t.
2. Production bug count
When users say the UX is somehow broken, rarely can anyone argue with their experience.
Counting production bugs is critical since each of them can affect their experience.
The reduction in production bugs also proves the improvement in code quality.
3. Cycle time
This metric tracks the journey from when a developer starts a task until it reaches production.
If you want to expose the bottlenecks that block delivery, start observing it.
Soon, you’ll recognize where in the SDLC the team gets stuck most often.
We analyzed one feature team with a 20-day cycle time.
Development took only 3 days. Then, QA needed 2 weeks for testing.
We taught developers to test their code, and the cycle time dropped to 1 week.
4. Lead time
Lead time adds planning and refinement time to cycle time, measuring a task’s delivery from backlog entry to the release.
When stakeholders ask for new features under a dead-set deadline, lead time can reveal if the expectations are realistic based on the actual delivery history.
If the team’s lead time averages 50 days, promising any feature delivery in two weeks would be a guaranteed failure.
How to refocus the team
1. Start with transparency
Normalize working with engineers on the 4 metrics I’ve mentioned:
Deployment frequency
Production bug count
Cycle time
Lead time
The key is to show how their releases improve them.
For example, put the numbers on screen during your meetings and demonstrate how having developers test their own code reduces production bugs.
IT teams must see the same dashboards that managers use.
When the metrics are transparent, the discussion about them changes from defending against management to solving problems together.
2. Improve the metrics in the right order
Fix deployment frequency first.
Your ability to respond to emergencies depends on it.
Once the feature team deploys more often, it can focus on reducing production bugs.
After you improve deployment and quality, optimize for delivery speed by shortening the cycle and lead time.
This order prevents teams from shipping subpar code faster.
3. Measure the metrics using existing tools
Your CI/CD pipeline already shows deployment frequency automatically without extra tools.
Support tickets can count your production bugs clearly if you categorize them.
JIRA and similar platforms track cycle and lead time with the right config.
Other than that, a spreadsheet is enough to track these 4 numbers consistently.
4. Add a north star metric later
With the monitoring for the 4 efficiency metrics in place, you can improve delivery even more by adding a north star.
For example, Booking.com once used monthly reservations.
Technical improvements only mattered if they drove more reservations from users.
This single metric unified the entire organization around business value.
Other companies might pick another metric, such as user engagement or revenue per customer, instead.
Next time
Now that you know which metrics actually matter, let’s face the next bottleneck.
At least this one report suggests 75% of developers lose up to 15 hours weekly because they juggle around too many tools.
Without proper mentoring, IT teams might work with different databases or component libraries.
In the next issue, you’ll learn how we cut our project setup time by 80% through standardization.
Thanks for reading! ✌️
🟣 Substacks we read
If Effective Delivery helps you see the system, Thriving in Engineering helps you thrive inside it.
Join thousands of leaders and managers who subscribe for practical guides, frameworks, and stories that help you take control of your career.
Written by 25+ year industry veteran, Alex Ponomarev – it’s where tech leaders go to grow.


Published with a smirk by The Software House
Twarda 18, Warsaw, Poland
tsh.io →
 | A guest post by
|